
Series: Lập trình Raspberry Pi & Ứng dụng thực tế Phần 3 — Python “build app thật” Bài 16: Web dashboard mini — hiển thị chart + history (FastAPI + HTML + Chart.js)
1) Mục tiêu bài học
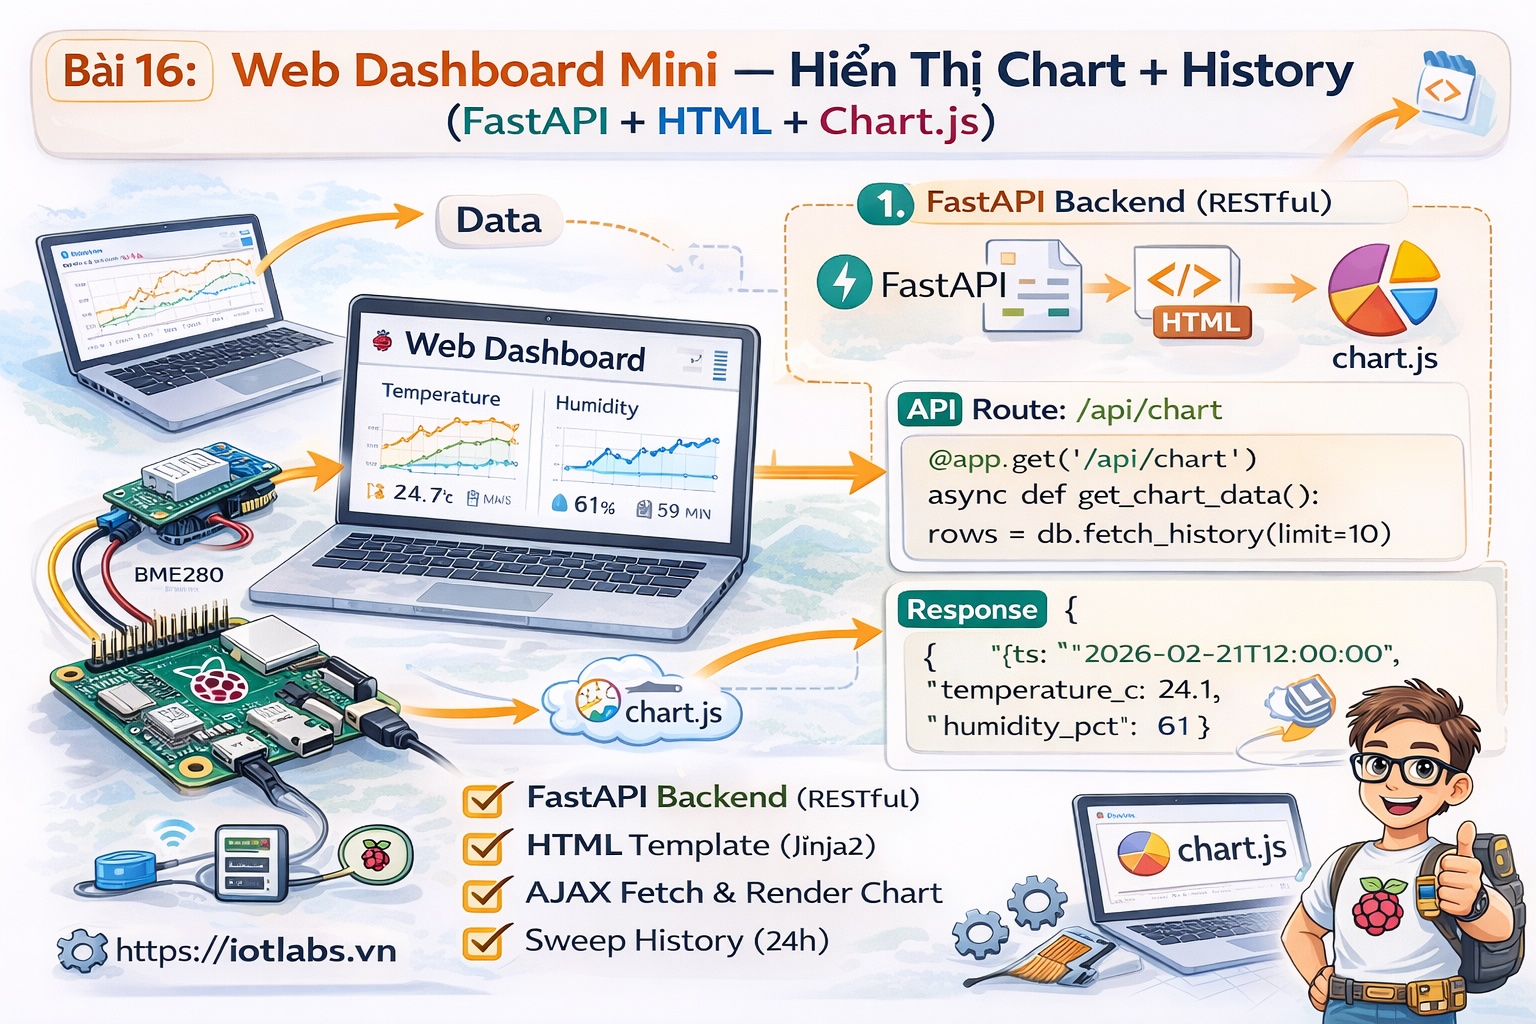
Sau bài này bạn sẽ:
- Có dashboard web mini chạy trên Raspberry Pi.
- Xem nhanh:
- latest telemetry
- lịch sử 50–200 điểm gần nhất
- biểu đồ line chart (Chart.js)
- Dùng dữ liệu từ SQLite (Bài 15) và API FastAPI (Bài 13).
2) Chuẩn bị
Trong project ~/apps/iotlabs-py-agent:
- Đã có src/api.py (Bài 13)
- Đã có SQLite storage (Bài 15)
Cài thêm:
cd ~/apps/iotlabs-py-agent
source .venv/bin/activate
pip install jinja2
3) Thêm query history trong SQLite
Mở src/storage_sqlite.py, thêm hàm:
def list_telemetry(device_id: str, limit: int = 200):
    with sqlite3.connect(DB_PATH) as conn:
        cur = conn.execute(
            "SELECT ts, temperature_c, humidity_pct FROM telemetry WHERE device_id=? ORDER BY ts DESC LIMIT ?",
            (device_id, limit)
        )
        rows = cur.fetchall()
        # trả về theo thứ tự thời gian tăng dần cho chart
        rows.reverse()
        return [{"ts": r[0], "temperature_c": r[1], "humidity_pct": r[2]} for r in rows]
4) Tạo template HTML dashboard
Tạo thư mục templates:
mkdir -p templates
nano templates/dashboard.html
Dán nội dung:
<!doctype html>
<html lang="vi">
<head>
  <meta charset="utf-8" />
  <meta name="viewport" content="width=device-width,initial-scale=1" />
  <title>IoTLabs Pi Dashboard</title>
  <script src="https://cdn.jsdelivr.net/npm/chart.js"></script>
  <style>
    body { font-family: Arial, sans-serif; margin: 16px; }
    .row { display: flex; gap: 16px; flex-wrap: wrap; }
    .card { border: 1px solid #ddd; border-radius: 10px; padding: 12px; min-width: 260px; }
    canvas { max-width: 980px; }
    small { color: #666; }
  </style>
</head>
<body>
  <h2>IoTLabs Pi Dashboard</h2>
  <small>device_id: <b>{{ device_id }}</b> | updated: {{ now }}</small>

  <div class="row" style="margin-top:12px;">
    <div class="card">
      <div><b>Latest</b></div>
      {% if latest %}
        <div>ts: {{ latest.ts }}</div>
        <div>T: {{ latest.temperature_c }} °C</div>
        <div>H: {{ latest.humidity_pct }} %</div>
      {% else %}
        <div>Chưa có dữ liệu</div>
      {% endif %}
    </div>

    <div class="card">
      <div><b>Quick tips</b></div>
      <div>• /health, /metrics</div>
      <div>• /api/telemetry/history</div>
    </div>
  </div>

  <h3 style="margin-top:18px;">Biểu đồ nhiệt độ & độ ẩm</h3>
  <canvas id="chart" height="120"></canvas>

  <script>
    const labels = {{ labels | safe }};
    const tempData = {{ temp | safe }};
    const humData  = {{ hum | safe }};

    const ctx = document.getElementById('chart').getContext('2d');
    new Chart(ctx, {
      type: 'line',
      data: {
        labels,
        datasets: [
          { label: 'Temperature (°C)', data: tempData, tension: 0.2 },
          { label: 'Humidity (%)', data: humData, tension: 0.2 }
        ]
      },
      options: {
        responsive: true,
        interaction: { mode: 'index', intersect: false },
        plugins: { legend: { position: 'top' } },
        scales: { x: { ticks: { maxTicksLimit: 8 } } }
      }
    });
  </script>
</body>
</html>
5) Thêm endpoint API + page dashboard vào FastAPI
Mở src/api.py và bổ sung:
5.1 Imports
Thêm:
from fastapi.responses import HTMLResponse
from fastapi.templating import Jinja2Templates
from fastapi import Request
from src.storage_sqlite import ensure_db, latest_telemetry, list_telemetry
5.2 Init templates
Sau app = FastAPI(…) thêm:
templates = Jinja2Templates(directory="templates")
ensure_db()
5.3 Endpoint JSON history
Thêm:
@app.get("/api/telemetry/history")
def telemetry_history(device_id: str = "pi-gw-01", limit: int = 200):
    return {"device_id": device_id, "items": list_telemetry(device_id, limit)}
5.4 Dashboard page
Thêm:
@app.get("/", response_class=HTMLResponse)
def dashboard(request: Request, device_id: str = "pi-gw-01", limit: int = 200):
    latest = latest_telemetry(device_id)
    items = list_telemetry(device_id, limit)

    labels = [i["ts"][11:] for i in items]  # HH:MM:SS
    temp = [i["temperature_c"] for i in items]
    hum  = [i["humidity_pct"] for i in items]

    return templates.TemplateResponse("dashboard.html", {
        "request": request,
        "device_id": device_id,
        "latest": latest,
        "labels": labels,
        "temp": temp,
        "hum": hum,
        "now": datetime.now().isoformat(timespec="seconds"),
    })
6) Chạy và xem dashboard
Chạy:
source .venv/bin/activate
uvicorn src.api:app --host 0.0.0.0 --port 8000
Mở trên trình duyệt:
- http://<IP_CUA_PI>:8000/
Nếu bạn bật UFW, mở port 8000 theo Bài 13/Bài 4.
7) Bài tập nâng cấp
- Thêm chart pressure (nếu dùng BME280).
- Thêm filter from_ts/to_ts để query theo khoảng thời gian.
- Cache 5 giây để dashboard tải nhanh hơn.